
Supply Chain Planning Clarity: Where Effective Planning Really Starts
Supply chain planning rarely fails because of bad tools. It fails because clarity is missing.
In many organizations, planning starts with forecasts, dashboards, or system discussions. But when teams are not aligned on what decisions actually need to be made, by whom, and when, every layer built on top becomes fragile. KPIs multiply without purpose, data debates replace decisions, and planning meetings drift into status updates instead of real governance moments.
Clarity in supply chain planning does not come from adding more functionality. It comes from structuring thinking. Before touching tools or data models, planning needs a clear backbone built around three elements: decisions, KPIs, and data.
Why Planning Breaks Without Clarity
When decisions remain implicit, planning becomes reactive. Teams optimize locally, functions measure success differently, and accountability blurs. Dashboards grow, reports multiply, yet confidence in decisions decreases.
Most planning complexity is not technical. It is structural. Without clarity, even the best planning systems amplify confusion instead of resolving it.
Mapping the Decisions That Matter
Every planning process exists to support decisions, yet many organizations struggle to clearly articulate what those decisions are.
Instead of starting with reports or data, planning conversations should start with a simple question: What are the decisions we need to make to run the business?
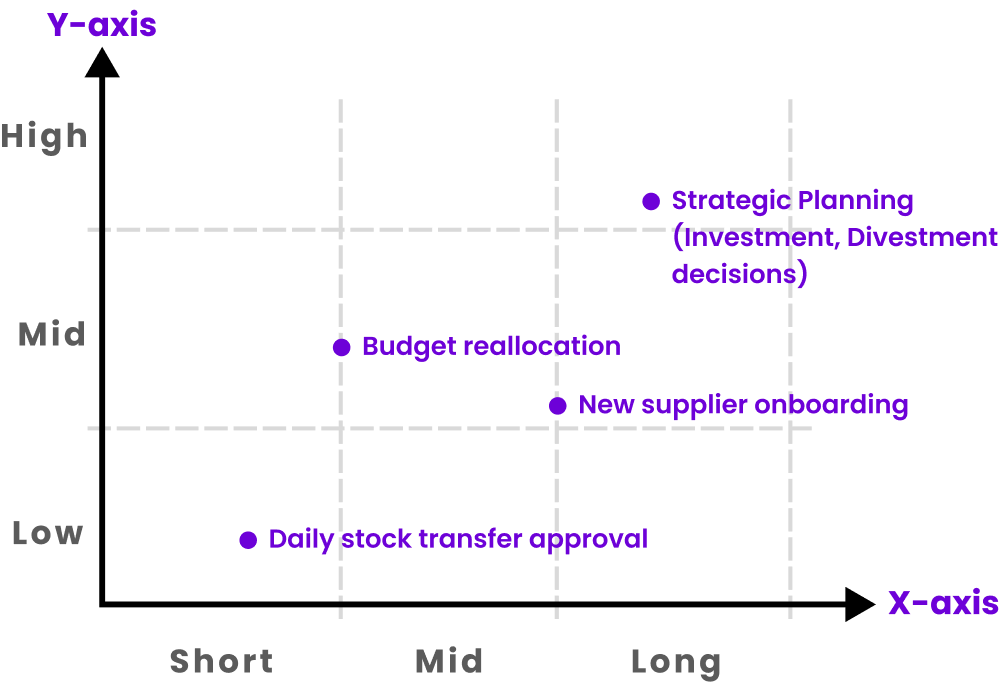
Once identified, decisions can be structured along two dimensions: their importance and their time horizon. Some decisions are operational and frequent, others are rare but strategic. Plotting them this way quickly reveals where time is wasted, where ownership is unclear, and where critical decisions lack preparation.
This mapping exercise brings immediate clarity. Ownership gaps surface. Decision forums become sharper. Planning shifts from reviewing numbers to preparing choices.
Defining KPIs That Enable Decisions
Planning rarely fails due to a lack of metrics. It fails because metrics are disconnected from decisions.
Dashboards become overloaded, functions track different objectives, and KPIs lose credibility when no one is certain how or when they should be used. The result is misaligned reviews and slower decision-making.
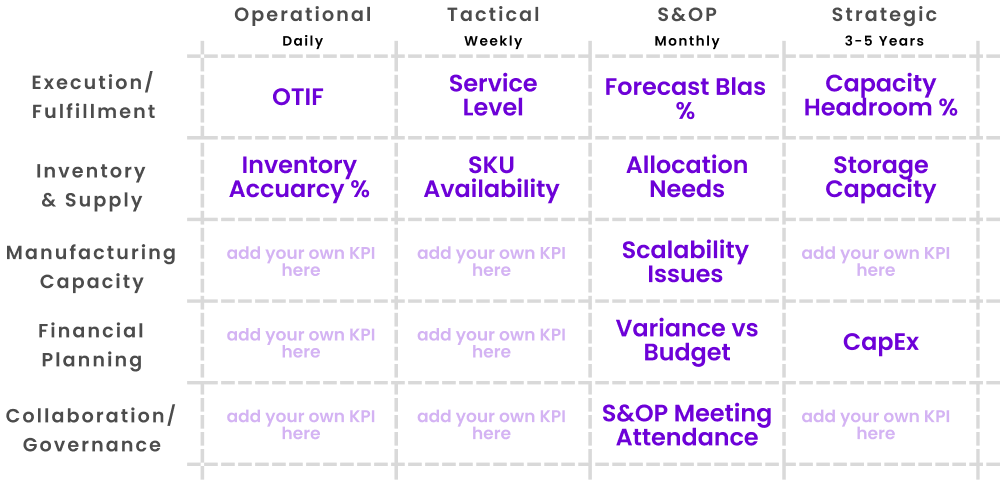
KPIs should be treated as decision enablers, not reporting outputs. Each KPI should exist to support a specific decision at a specific time horizon.
Before a KPI earns its place, it should answer three questions: if it changes, can someone act? Is it clearly tied to a decision forum? Is the data trusted by the people using it? Metrics that fail these tests dilute focus rather than improve it.
Tracing and Trusting the Data Behind KPIs
Even well-defined KPIs fail when the data behind them cannot be trusted.
In most planning environments, data issues stem from unclear ownership, inconsistent definitions, and fragmented sources. The same KPI can produce different values depending on who runs the report. This erodes confidence and shifts conversations away from decisions.
Stabilizing this foundation starts by tracing each critical KPI back to its source. Teams should be able to clearly answer where the data comes from, who owns it, how often it is reviewed, and whether it is structured for planning use.
A focused data quality check across accuracy, timeliness, completeness, and usability is often enough to restore trust. The goal is not perfection, but reliability.
Anchoring Data to Ownership
Data without ownership deteriorates quickly. Every critical data point must have a clear owner, a defined review cadence, and a known downstream flow.
When ownership is missing, warning signs appear: uncontrolled Excel copies, inconsistent definitions, misaligned units, and KPI values that vary depending on who pulls the report. These are governance issues, not system issues.
Ownership turns data into a dependable planning asset.
The Clarity Loop in Practice
When decisions are explicit, KPIs are purposeful, and data is trusted, planning changes fundamentally.
Meetings become decision-driven. Responsibilities align naturally. Tools start supporting the process instead of compensating for its gaps. Planning stops being reactive and becomes something the organization can steer.
Supply chain planning clarity is not a sequence of steps. It is a way of structuring how decisions, performance, and data connect. When that structure is in place, complexity reduces and execution accelerates.